A grid of evenly spaced, small white dots arranged in a circular pattern on a light gray background. The dots gradually fade out toward the edges.

Biological Transport and Networks: Vascular Flows in the Yolk Sac

We combine high-speed microscopy, image analysis, and physical modeling to reconstruct blood flow across the embryonic yolk sac.

The heart begins beating while the yolk sac’s vascular network is still a dense, immature plexus. How does blood move through this network, and how does each heartbeat travel through it? We reconstruct both, across the whole yolk sac, in three different avian embryos at successive stages of development. Each is staged by its number of somites, the paired blocks of tissue that form one after another along the embryo’s body axis, so the count serves as a developmental clock (a new pair forms roughly every 90 minutes).

Imaging and Measuring Flow

High-speed video of the capillary network of a 21-somite yolk sac (slowed), with the reconstructed vessel graph; the inset shows where this field of view lies in the embryo. For the highlighted vessel: the fitted velocity profile at each cross-section, and its volumetric flow rate over time. Imaging: Siavash Ghaffari, Elizabeth A. V. Jones lab.

Imaging such an organ is a challenge in itself: high-speed microscopy (250 frames per second) can only record it one field of view at a time, while the network continues to develop. We stitch these recordings into whole-organ networks of thousands of vessels.

In each vessel, the motion of red blood cells gives the velocity profile across the vessel, and from it the volumetric flow rate through every heartbeat: both its mean and its pulsatile part.

An Organ-Scale Flow Field

The one field of view (inset) that records both boundaries of the network at once: the two dorsal-aorta stubs carrying blood in (red) and the two venous stubs carrying it back out (blue), with each one’s flow relative to its mean over time (right; smoothed for display). The arterial and venous pulses are in phase. Imaging: Siavash Ghaffari, Elizabeth A. V. Jones lab.

Combining the recordings gives a picture of blood flow across the entire yolk sac: where blood enters from the dorsal aorta, how it spreads through the plexus, and where it drains back into the veins. The video shows the one region where both meet: blood arrives through the two branches of the dorsal aorta and returns through the veins alongside, pulsing in step with the same heartbeat.

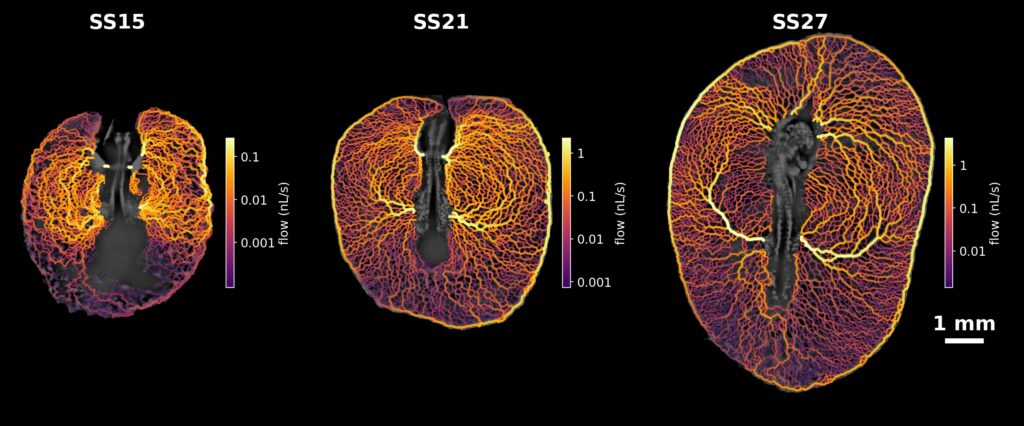
Three scientific imaging panels labeled SS15, SS21, and SS27 showing the development of a branching vascular network over time, with a color-coded legend indicating flow rates in nL/s.
Simulated blood flow through the yolk-sac networks of three embryos at 15, 21 and 27 somites (SS), based on the measured vessel diameters. Brighter, thicker vessels carry more flow (separate scale for each embryo). Imaging: Siavash Ghaffari, Elizabeth A. V. Jones lab.

Driving a simple model of passive flow through the measured vessel diameters reproduces much of this field, suggesting that the network’s geometry largely sets where the blood goes. Across the three embryos a hierarchy emerges: at 15 somites flow spreads through a fairly uniform mesh, while by 27 somites a few large arteries and the encircling marginal vein carry most of it.

What the Pulse Reveals

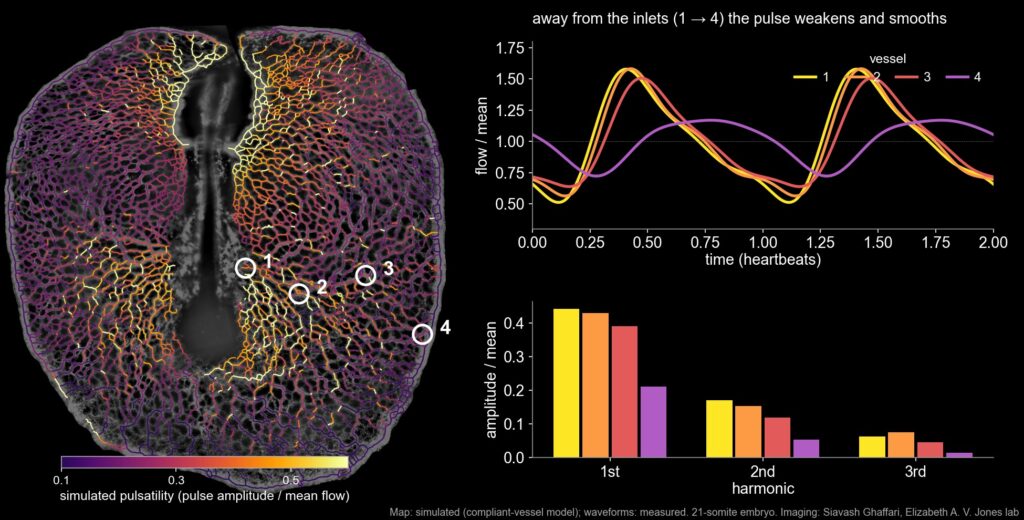
An image showing a color-mapped visualization of fluid flow in a 21-somite embryo, alongside a line graph of flow over time for four vessels and a bar graph comparing flow harmonics.
Pulsatility across a 21-somite yolk sac, simulated with the compliant-vessel model fitted to the measurements (left); vessels with almost no mean flow are shown faint. For four measured vessels at increasing distance from the arterial inlets: the measured flow over two heartbeats relative to its mean (top right) and its harmonic content (bottom right). Away from the inlets the pulse weakens and its higher harmonics fade fastest. Imaging: Siavash Ghaffari, Elizabeth A. V. Jones lab.  

Each heartbeat sends a pulse through the plexus. Close to where blood enters, flow surges sharply with every beat; towards the edge of the yolk sac the pulse is weaker and smoother. Its sharpest features, the higher harmonics, fade first: the network acts as a low-pass filter.

That filtering comes from the elasticity of the vessel walls, which briefly stretch to store blood during each beat. A model of the network as elastic, compliant vessels, fitted to how the pulse is delayed and damped from vessel to vessel, gives an estimate of how stiff these young vessel walls are. It also shows the limits of inferring an organ’s physics from measurements made one region at a time.