Single-Nucleus RNA Sequencing Identifies Brain Cell Types With Significant Changes in Gene Expression in Autism
Featuring
-

Arnold Kriegstein
SFARI Investigator
Bringing people and ideas together to fund, conduct, and share transformative science.
Our grants advance knowledge and strengthen connections between science and society.
Discover the latest news, research, and updates.
We convene scientists, mathematicians, and thinkers to share ideas and explore new questions.
Founded by Jim and Marilyn Simons, we’re a private philanthropy advancing mathematics and basic science.
Work with us on the frontier of basic science research.
The Flatiron Institute is a research center that uses computational science to advance fields like physics, biology, and astronomy.
Search
Using single-nucleus RNA sequencing of postmortem cortical tissue from individuals with ASD, Arnold Kriegstein and colleagues identify upper-layer excitatory neurons and microglia as key cell types affected in ASD.
SFARI Investigator
Although bulk transcriptional profiling studies of postmortem autism spectrum disorder (ASD) brain samples have identified shared changes in gene expression (e.g., Parikshak et al., Nature, 2016), little information has been available as to how these changes map to specific cell types. SFARI Investigator Arnold Kriegstein and colleagues now use single-nucleus RNA sequencing (snRNA-seq) to identify key cell types in the developing brain that show disproportionate dysregulation of gene expression, with enrichment for genes known to be involved in ASD risk.
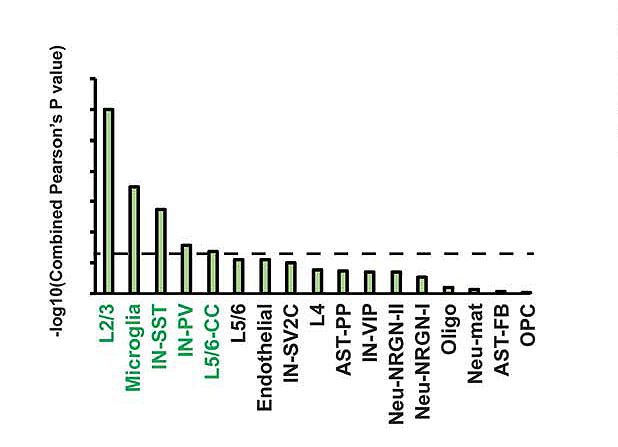
In the new work, supported in part by a SFARI Pilot Award, Kriegstein’s team carried out snRNA-seq on 41 postmortem brain samples, including prefrontal cortex and anterior cingulate cortex, from 15 individuals with ASD and 16 controls. Unbiased clustering identified significant changes in gene expression, particularly in upper layer (layer 2/3) excitatory neurons, vasoactive intestinal polypeptide (VIP)-expressing interneurons, protoplasmic astrocytes and microglia. Moreover, there was a highly significant overlap in those genes showing dysregulated gene expression in the ASD samples and those that have been implicated in the etiology of ASD.
These data are consistent with previous work identifying layer 2/3 neurons as a cell type where high-confidence ASD risk factors exhibit convergent patterns of gene expression (Parikshak et al., Cell, 2013). Among the dysregulated genes is SOX5, which is noteworthy in light of its potential role in regulating the expression of the gene set that shows attenuated cortical patterning in the ASD brain (Parikshak et al., Nature, 2016). Finally, the authors show that individuals with different degrees of clinical severity, as measured by scores on the Autism Diagnostic Interview–Revised (ADI-R), clustered according to dysregulation of genes in layer 2/3 neurons and microglia.