New Dataset Explores Neuronal Basis of Behavior
Fruit fly biologists have a massive new resource at their disposal — a comprehensive database that predicts which brain cells are involved in different behaviors. The resource, created by Kristin Branson and her collaborators at Janelia Research Campus in Ashburn, Virginia, was gleaned from 225 straight days of video footage monitoring 400,000 flies from more than 2,000 different strains. Researchers can use the data — all publically available — to develop and test new theories of how the brain creates behavior.
“This is probably the most dramatic example of this kind of big-data approach,” says Andrew Leifer, a neuroscientist at Princeton University and investigator with the Simons Collaboration on the Global Brain. Most scientists focus on a specific brain structure or type of behavior. But Branson and her collaborators took a more global approach, systematically activating different subsets of neurons and measuring many different kinds of behavior, Leifer says. “I think this is an important direction for the field to go.”
The researchers started with a vast collection of fly lines known as GAL4 lines, which are engineered to house a genetic switch in different subsets of neurons. Exposing these flies to heat activates the targeted neurons, some of which can trigger different behaviors in the fly. Previous research at Janelia had mapped the targeted neurons for each line. But it was unclear what role they played in behavior.
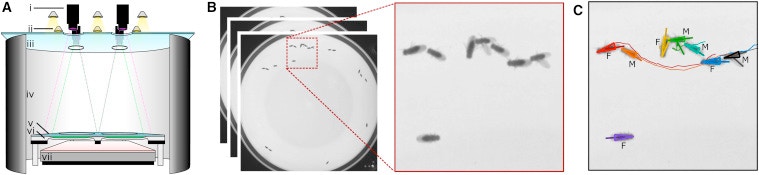
To create a catalog of behavior, Branson’s team recorded video of 10 males and 10 females of each line as the flies walked freely in a dish for 15 minutes. They then trained machine-learning classifiers to recognize different kinds of behavior, including walking forward and backward, jumping, chasing, wing extension and male courtship singing. “This was an exciting, large dataset to try out the newest computer-vision and machine-learning techniques for characterizing behavior,” Branson says.
Almost all the fly lines showed a discernable change in behavior. Some jumped much more often than others, some chased excessively, and others huddled together.
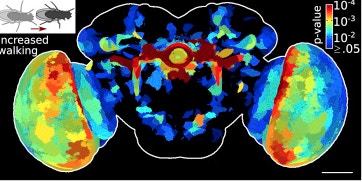
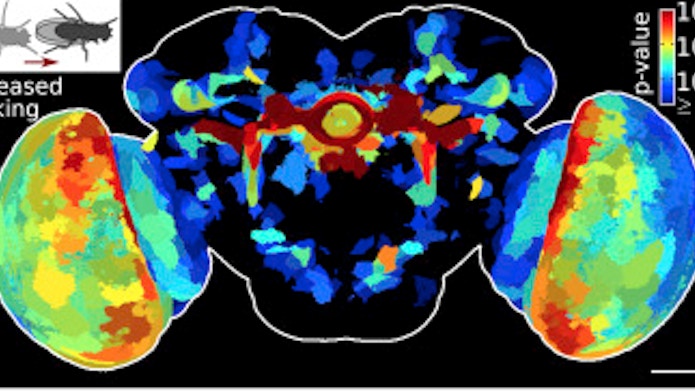
To determine which neurons are involved in a specific behavior, such as jumping, the researchers examined all the lines that showed changes in that behavior, such as an increase in jumping frequency. They then looked for overlap among the neurons targeted in those lines. “That leads to a hypothesis of which brain areas are involved in jumping,” Branson says.
The end result is a map of the fly brain showing how correlated each pixel of brain tissue is to a specific behavior. The research was published in Cell in July.
Generating hypotheses:
One of the challenges of the project was choosing how to handle such a large, diverse dataset. “We had on the order of a petabyte of data,” Branson says. “Figuring out how to extract meaningful structure from that was the hardest part for me.” For example, looking for correlations between behavior and activity at each voxel in the brain is statistically problematic — 30 million voxels produce 30 million individual hypotheses.
To address that issue, the researchers clustered brain areas based on common gene expression. “The assumption we made is that two voxels are probably part of the same functional unit if, across all GAL4 lines, either all have expression or don’t have it,” Branson says.
The map generates hypotheses about which brain areas are involved in different behaviors, but further testing is required to confirm those predictions. For example, to home in on the neurons that stimulate walking, Branson and her collaborators started with the brain areas linked to increased walking. They then created fly lines that express a genetic switch in smaller and smaller subsets of these cells, an approach known as the split GAL4 technique, eventually identifying a subset of neurons in the fly ellipsoid body that are sufficient to trigger walking.
One interesting finding from the study is that individual fly lines showed changes to a suite of behaviors, such as foraging or mating, more often than they showed changes in individual behaviors, such as backing up or jumping. “Collections of sub behaviors, what they call “modules,” are more likely to be upregulated together than individual sub-behaviors,” Leifer says. “That’s really interesting.”
Leifer says this could occur for a number of reasons, all of which have potentially interesting implications for how the brain generates behavior. “It could be that the brain is hard-wired such that these suites of behaviors are upregulated together,” he says. “That tells us something about how the brain is organized.”
It’s also possible that the long timescale of neural activation used in the experiment — they stimulate neurons for minutes — preferentially selects for longer timescale behavior states such as foraging and arousal, Leifer says. “This also would be interesting because it would tell us something about the relationship between timescales of brain activity and behavior.”
A shared resource:
Given the novelty and scale of the map, some questions remain. “As is the case with lots of high-throughput analysis, there’s the question of how to validate findings like this,” says Benjamin de Bivort, a fly biologist at Harvard University. For example, if researchers repeated the screen with a different set of fly lines, would they get the same results? That type of validation is impractical given the scale of the project, says de Bivort. Indeed, this type of large-scale project would have been difficult to conduct outside of an institution like Janelia, which has its own funding and a commitment to creating tools for the broader community. But scientists can try to replicate individual results.
The researchers created the dataset with the intent of sharing it and hope others will use the map to generate and test their own hypotheses. “We want biologists to be able to use the data easily, we want them to find their behavior or brain area of interest and follow up on the findings,” Branson says. “We spent a lot of effort on curating our data, as well as on making the data digestible at multiple levels of resolution.”
Branson points out that because the map was generated by stimulating neurons and recording the resulting behavior, it will be important for other scientists to confirm links between brain and behavior by using recording technology, such as electrophysiology or calcium imaging, to track neural activity during specific behaviors.
To help other scientists explore the data, Branson’s team created a program called the Browsable Atlas of Behavior Anatomy Maps (BABAM). All the videos they recorded are available on YouTube. “They should get major props for releasing everything in a really accessible way,” Leifer says.
Scientists are excited about the new resource. De Bivort anticipates using the data to cross-validate his own research. “How much they put online and how they made it so searchable, that’s really excellent for the field,” he says.
Branson notes that the field is just beginning to figure out how to share and analyze large datasets. She hopes the tools they develop will be applicable to other large neuroscience projects. “It’s a lot more work to create useful data than you might anticipate,” she says.

