The Hidden Mathematical Patterns Behind Seemingly Random Events
Some aspects of everyday life follow predictable patterns, such the flow of traffic during a standard weekday. Such predictable patterns are easy to spot and chart, but even seemingly random events follow a hidden mathematical formula. Simons Junior Fellow Jiaoyang Huang works to understand the mathematics behind apparently random events.
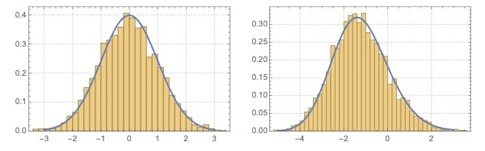
Most of us have seen the bell curve, which depicts a standard statistical distribution for many phenomena, such as a population’s average weight. People tend to cluster around the median of such variables. Fewer people are at the extremes; there are relatively few 50- or 450-lb. adults, for example. The result is the famous bell-shaped curve with two long tails, one on each side.
Represented mathematically as the Gaussian distribution, the bell curve is useful for understanding many things — but it may not accurately capture everything, particularly the effects of random natural forces, such as the growth of bacteria in a petri dish and the slow combustion of paper. Mathematician Jiaoyang Huang, a second-year Junior Fellow with the Simons Society of Junior Fellows, works to uncover and describe the laws governing random events that seem to defy standard Gaussian distributions. Part of the appeal for Huang, who studies what is known as random matrix theory, lies in the beauty of pure mathematics. But this work also could have practical applications in helping to understand the underlying mathematics of the natural world.
Huang earned a bachelor’s degree in mathematics at MIT and a doctorate at Harvard University. He is currently a postdoctoral researcher at NYU’s Courant Institute, working with advisor Paul Bourgade. Huang and I recently discussed his work; our conversation has been edited for clarity.
Your work centers on random matrix theory. What are random matrices and the related concept of random graphs?
A random matrix is a matrix in which some or all its entries are random variables. It was introduced by the physicist Eugene Wigner in the 1950s to model the nuclei of the heavy atoms found in atomic bombs. Since then, additional fields within science and engineering, from condensed matter physics to statistics, have found random matrix theory valuable. The physicist Freeman Dyson, whom some may know, is a pioneer in random matrix theory.
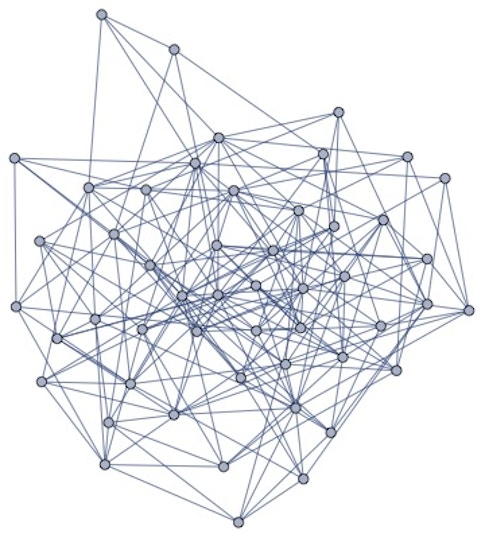
Relatedly, random graphs are used to model large real-world networks that grow randomly, such as relationships between friends or colleagues. In essence, a random graph is really a way to model random growth that can’t be predicted in advance. For example, we can use random graphs to represent a social network of friends or co-workers. We represent each person with a vertex, and if two people know each other, we draw an edge between their corresponding vertices, resulting in a graph that shows their relationships. I study random graphs from the random matrix point of view, by representing graphs as matrices.
One component of my research uses tools from random matrix theory to better understand the properties of random graphs like those for social networks, which is how I uncover the hidden math behind seemingly random occurrences.
What are some of the key concepts that underlie this work?
There are two foundational elements of my work, which relate to each other.
One is the eigenvalues, which are a set of numbers associated with a matrix. Roughly speaking, the eigenvalues tell you how the space is distorted when we multiply a matrix. For a graph, the eigenvalues contain its geometric information. For example, the largest eigenvalue tells the average number of edges connecting each vertex of a graph.
The Tracy-Widom distribution, which derives from eigenvalues of random matrices and was discovered by the mathematicians Harold Widom and Craig Tracy in the 1990s, describes the fluctuation of the largest eigenvalue. Soon after its discovery, the distribution was showing up all over physics and mathematics. It turns out that complex systems consisting of interacting random events actually behave in statistically predictable ways. Bacteria growing in a petri dish follow the patterns predicted by Tracy and Widom, as does the spread of a fire or formation of crystal. This is really at the heart of my work detecting order within randomness.
Along those lines, how have you used the Tracy-Widom distribution in your work?
Besides random matrices or random graphs that model growth patterns that cannot be predicted in advance, we also would expect to see the Tracy-Widom distribution in what are known as random tiling models. Random tiling models exhibit a phase change from a frozen region to a liquid region, such as when ice moves from a solid state to the liquid state of water. During my first year as a Simons Junior Fellow, I showed that for random tiling models, the fluctuation of the boundaries between the liquid and solid phases follows the Tracy-Widom distribution. So once again what appears to be random is actually following a hidden mathematical law.
That’s a great use of the fellowship! What are you doing now, during your second year as a Simons Junior Fellow?
One key goal of mathematicians is to identify a central object, which is basically a single key that can unlock many doors. For example, now that I know that the Tracy-Widom distribution holds at the liquid/solid boundary for random tiling models, where else does it apply? It would be great to establish all the conditions in which apparent randomness follows hidden mathematical laws. For large systems that consist of many independent random variables, like the individual weights of a group of people, the statistical patterns are not random, and can be described by the bell curve. But it may be that we need other tools for understanding systems that have many strongly interacting components, where we will see the Tracy-Widom distribution instead of the Gaussian distribution that underlies the bell curve. That’s what I am working on.
How has the Simons fellowship helped this work?
I am truly grateful to the Simons Foundation for providing the financial support to pursue the research I care about. My first year of the fellowship was during the pandemic, and it was a bit isolated having no in-person gatherings with other fellows to learn about their research. Thank goodness we are now meeting in person once again!