
Uncovering Hidden Dimensions in Brain Signals
Imagine a room that has a clock on one wall, with a single hand indicating the hour. The room is three-dimensional, but the space covered by the clock hand is only a two-dimensional circle. What’s more, the valuable information in the clock hand’s activity is actually contained in just one dimension: The angle of the clock hand tells us everything we need to know about the information the clock represents. But if we have a stack of data representing the 3D coordinates of the hand over time — even if we have no idea what it was doing — can we figure out the dimension where the most valuable information lies?
This is the question faced by modern neuroscientists, who can collect the activity of thousands of neurons at a time — creating an activity space much larger than just three dimensions — without necessarily knowing what computations those neurons are performing. To aid their explorations, many studies have used dimensionality reduction techniques, which provide a description of high-dimensional data using fewer variables, to help identify the most important activity patterns in the data. Dimensionality reduction is a useful tool for identifying latent variables and visualizing data.
But commonly used linear techniques, such as principal component analysis (PCA), have limited power. They can identify the 2D plane of the clock in the room, for example, but not the fact that the angle of the hand is what’s relevant.
However, researchers are now developing a more diverse arsenal of techniques to characterize and understand the lower-dimensional topology that exists in high-dimensional data. These nonlinear methods get around many of the limitations of PCA that cause it to miss important patterns in the data. This gives them a better shot at identifying the relevant dimensions and properly characterizing the shape of the data.
Discovering Manifolds: SPUD
Ila Fiete, a neuroscientist at the Massachusetts Institute of Technology and an investigator with the Simons Collaboration on the Global Brain (SCGB), and Rishidev Chaudhuri, an assistant professor at the University of California, Davis, describe one such method in an article published in Nature Neuroscience in August. They tested their new method, known as spline parameterization for unsupervised decoding, or SPUD, on neural activity in the anterodorsal thalamic nucleus (ADN), a region that houses neurons known to encode head direction.
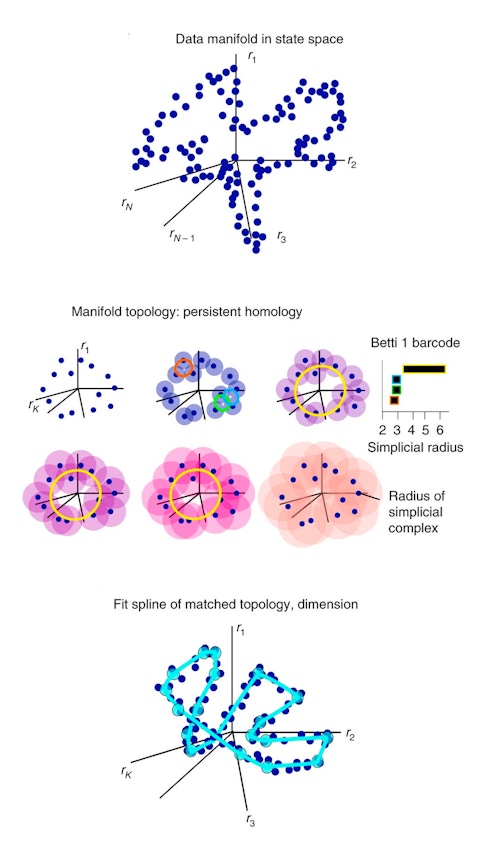
SPUD starts by placing the activity of individual neurons on separate axes in a high-dimensional space, creating a point cloud of data. The shape of that point cloud is then characterized using a technique called persistent homology, which determines which features of the shape remain as the resolution of the data is changed. Using this knowledge about the data’s shape, researchers calculate its intrinsic dimensionality and fit a function to it. The benefit of fitting this function is that it provides a simple way to describe a given data point’s location on the manifold.
Using this method, they found that the activity of the ADN neurons recorded while the animal explored an open environment falls largely along a one-dimensional ring. What’s more, the population activity’s location on this ring at any moment could be used to predict the heading direction of the animal with high accuracy, despite the fact that information about heading direction is never used as part of the analysis method. Thus, this unsupervised analysis of the neural data successfully uncovered the relevant information represented by the population.
But is this ring of activity merely a reflection of the inputs to this circuit, or is it internally generated? To test this, Fiete’s group applied the same analysis to neural activity recorded while the animal was asleep — when these neurons would not be receiving sensory-driven input. Again, the data reflected a one-dimensional ring, indicating that this topology arises from the influence of internal circuitry. The findings implicate the ADN in creating and maintaining the head direction representation.
The ability to see the full topology of a region’s activity makes it possible to identify what that region is encoding and — importantly — what it is not encoding. If the data lies on a one-dimensional ring, it can only encode one variable. This technique differs from traditional decoding methods, where a researcher could only confidently say a population isn’t encoding anything else by “listing all other possible variables in the universe and checking that it does not co-vary with any of them,” Fiete says.
With this finding in hand, Fiete can now ask a new question: Why would the brain use so many neurons to encode a single variable? “That’s what keeps me up at night,” she says.
Fiete calls this style of analysis ‘manifold discovery,’ a way to characterize and understand the lower-dimensional topology that exists in high-dimensional data. Nonlinear dimensionality reduction gets around many of the limitations of PCA. But “manifold characterization is a much broader goal than dimensionality reduction,” Fiete says.
This is because dimensionality reduction doesn’t necessarily give a full picture of the shape of the population response. For example, there are many different ways a one-dimensional ring could be embedded in higher dimensions — for example, as a 2D circle, or as the outline of a saddle in 3D. Manifold discovery keeps this full picture in view.
Dimensionality reduction “places more emphasis on recovering coordinates for points that lie on the manifold; manifold discovery suggests additional interest in the structure of the manifold itself,” says Ryan Low, a research fellow at University College London.
Discovering Manifolds: MIND
Low, Sam Lewallen, a Swartz fellow at Harvard University, and SCGB director David Tank have also developed a method for manifold inference, described in a preprint in September 2018, which they use to explore hippocampal data. The work is a “lovely illustration of unsupervised discovery of the encoded variable,” Fiete says.
The hippocampus can represent space, either physical or abstract. Low and his collaborators recorded activity from the CA1 region of the hippocampus as rodents foraged in a 2D space or performed a sound manipulation task in 1D frequency space. (For more on this task, see “The Hippocampus Maps More Than Space.”) If the neural activity solely encoded the dimensions of the task being performed, it would be expected to fall on a two- or one-dimensional manifold, respectively.
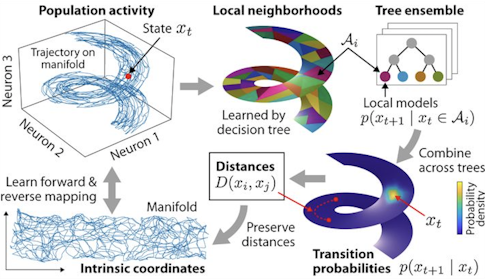
The method the Tank lab developed to identify the data manifold, known as manifold inference from neural dynamics (MIND), defines the distance between two patterns of neural activity as a function of how the network transitions between the patterns over time. According to Low, standard metrics like Euclidean distance “make a strong statement about what it means to be close,” whereas the MIND distance metric lets the data determine what ‘close’ is.
Given this notion of distance, the data can then be mapped to a lower-dimensional representation that keeps similar points nearby. These distances also provide a foundation for quantifying geometric properties of the data manifold, such as its intrinsic dimensionality. With this approach, neural activity during the 2D foraging task was well captured by three dimensions, and during the 1D auditory task it was well captured by two dimensions.
What does the extra dimension in each of these tasks represent? One possibility is noise, but Low suspects this isn’t the case. A standard model where activity encodes position or sound frequency along with unstructured noise didn’t explain the extra dimension. If these differences were truly meaningless noise, they should show up across many dimensions. Instead, this variability seems very structured. “Seeing just one extra dimension, that’s weird,” Low says.
Another cognitive or behavioral variable is a possibility. Neurons fire at particular locations in this extra dimension, just as they fire at certain locations in the physical world or for certain frequencies in the auditory task. And differences in how the neural trajectory moves through this extra dimension can explain why neural firing patterns differ even as the mouse explores the same location. However, the behavioral variables tested so far, such as running speed, have failed to explain the extra dimension. “People have been looking at hippocampal data for decades, and whatever this is, it’s been sitting there the whole time,” Low says. “It’s a bit of a mystery.”
Neither Low nor Fiete is surprised that the hippocampus shows this extra dimension while the head direction cells in the ADN do not. The head direction system is assumed to be very fixed and specially built for representing a single variable. On the other hand, “hippocampus is a very flexible structure for learning and memory,” says Fiete.
Discovering Manifolds: GPLVM
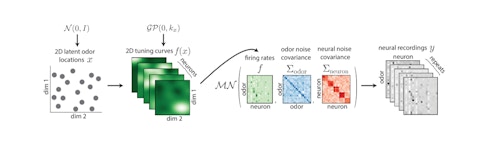
One of the biggest potential benefits of these types of manifold discovery techniques is the ability to study poorly understood brain regions, where researchers have little idea what the manifold might look like. In a 2018 NeurIPs paper, lead author Anqi Wu, working with SCGB investigator Jonathan Pillow on data from SCGB investigator Bob Datta, used an approach called the Gaussian process latent variable model (GPLVM) to analyze activity in the olfactory cortex, where the relationship between the physical properties of odor molecules and the neural representations they elicit has never been clear.
GPLVM aims to identify a latent manifold on which large changes in neural responses to odor can be seamlessly related to each other and hopefully related back to properties of the odor. Specifically, the activity of each neuron can be explained as a nonlinear function of the latent variables the model identifies, along with a noise term. With this method, researchers can predict the response of part of the population to a new odor by using the response of the rest of the population to determine the odor’s location in the latent space. Following this technique, the team was able to capture a large portion of the single-trial responses to new odors in the mouse piriform cortex.
Using an automated process to determine the right number of dimensions for the latent space, they found that the activity of many hundreds of piriform neurons can be represented by 10 to 15 latent dimensions. The biological interpretation of this 10-to-15-dimensional space remains unclear. “It’s a question that drives us to look deeper,” says Pillow. However, when the latent space is restricted to two dimensions, the odor responses form clusters that correspond to chemical features such as carbonyl functional groups. This provides hope that these unsupervised methods can identify relevant encoding variables.
Choosing the Right Method
Whether researchers use manifold discovery or dimensionality reduction, it is important for them to choose appropriately expressive methods that don’t impose too many restrictions. As SCGB investigator John Cunningham says, the methods should be “flexible enough so the data can speak for itself.” The issue with methods that look for particular information in the neural response is that there is a “risk of recapitulating the structure put in by the method.” Unsupervised methods that don’t put in any information about the task can thus lead to more persuasive and potentially more surprising results.
But even within the class of nonlinear methods, it’s worth considering which option is right for a particular dataset. As Cunningham points out, the space of available nonlinear methods is already large, with many new techniques developed since the standard bearer, Gaussian-process factor analysis, came out 10 years ago. The latest approaches of this type are neural network methods such as LFADS and structured variational autoencoders.
Low describes the MIND method as “pretty general purpose,” because each step in the analysis process can be adapted to fit the features of a particular dataset. However, sufficient neurons and time points are required, and the exact amounts needed will depend on details of the representation. Fiete also considers her approach of first identifying the global structure of the topology and then fitting functions to the data on a local level to be a general philosophy for approaching data with nontrivial structure. “Central to all these methods is the assumption there is some low-dimensional manifold that is there to be pulled out,” she says. She is particularly interested in testing her method on the grid cell system, where the data manifold is expected to take the shape of a torus.
Computational complexity, however, is an issue for nonlinear methods. According to Pillow, these methods can take longer to run and don’t have as many mathematical guarantees as simpler methods. “They require more care,” he says. “If you can get away with linear dimensionality reduction methods it would be better to.”
Still, he is excited about this era of neuroscience research. Methods now exist that make it possible to treat neural populations as the “fundamental objects of computation” and in a way that involves close collaboration between experiments and theory, he says.

